PTP Timing Budget Explained: How Nanoseconds Add Up Hop by Hop
A PTP network never fails its time target all at once. It spends the budget a few nanoseconds at a time — a little in every switch the timing passes through. This guide builds one budget hop by hop with real numbers (5 hops at 78 nanoseconds each is 390 nanoseconds worst case), shows where each piece of error comes from, explains why the worst-case sum and the statistical sum answer different questions, and then blows a budget on purpose — 20 hops at 1,560 nanoseconds against a 1,500-nanosecond limit — and fixes it three different ways.
The short answer
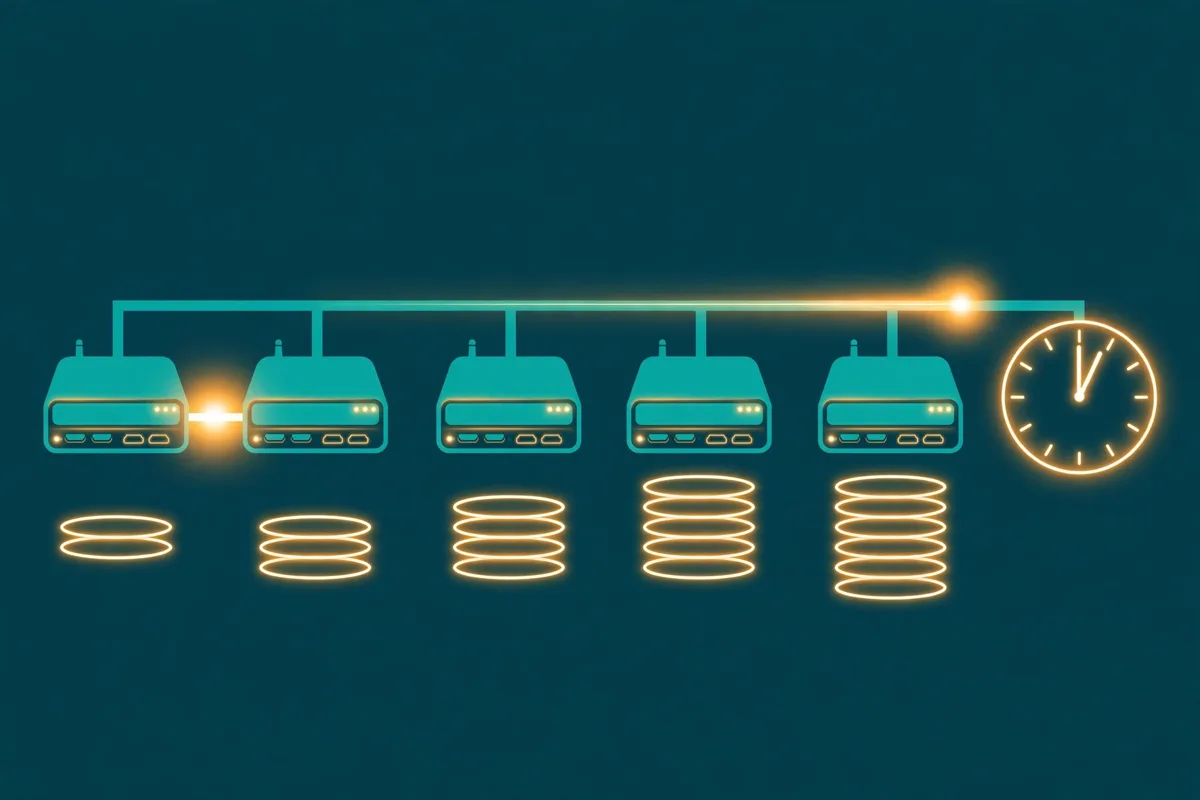
What is a PTP timing budget? It is a simple addition sum. Every device that PTP (Precision Time Protocol) timing passes through adds a small time error of its own. Add the error from every hop, plus the error in the links between them, and the total must stay smaller than the limit your job allows — for example plus-or-minus 1.5 microseconds (1,500 nanoseconds) end to end for a mobile radio network. If the sum fits, the design can work. If it does not, no amount of configuration tuning will save it, because the errors are built into the chain itself.
Think of it like a relay race where every runner hands over the baton a fraction of a second late. One runner losing 78 billionths of a second is nothing. Twenty runners each losing the same amount, always in the same direction, is a real delay — and unlike a race, you can work out the total on paper before you build anything. That paper sum is the timing budget, and doing it first is the difference between designing a timing network and discovering one.
Where each nanosecond comes from
The clock itself. A boundary clock is not a perfect relay. It measures the incoming time, disciplines its own oscillator, and regenerates time on its outgoing ports, and that process leaves a constant time error — in the worked example, 50 ns per clock. This is the figure vendors quote against the ITU-T G.8273.2 clock classes: Class A allows a maximum time error of 100 ns per clock, Class B 70 ns, and Class C 30 ns, with Class D setting a much tighter 5 ns limit on a filtered measurement. Better clocks cost more because this number is smaller.
The timestamps. PTP works by stamping packets as they leave and arrive. A timestamp can only be as fine as the clock that makes it: with 8 ns granularity, every stamp is rounded to the nearest 8 ns step, and that rounding is itself an error. Faster timestamping hardware makes the steps smaller; nothing in software removes them.
The path. PTP calculates delay by sending a message out and back and assuming each direction took half the round trip. If the forward fibre is longer, takes a different route, or runs at a different wavelength speed than the reverse, the two directions are not equal — and half the difference lands in the clock as error, silently, with no alarm. In the worked example that leaked asymmetry error is 20 ns per hop. It is the most dangerous term in any budget because it is a fixed bias: unlike random noise, it points the same way on every hop and never averages out.
The worked budget, hop by hop
| Per hop | Error | After 1 hop | After 5 hops | After 20 hops |
|---|---|---|---|---|
| Clock constant time error | 50 ns | 50 ns | 250 ns | 1,000 ns |
| Timestamp granularity | 8 ns | 8 ns | 40 ns | 160 ns |
| Asymmetry error | 20 ns | 20 ns | 100 ns | 400 ns |
| Total (worst case) | 78 ns | 78 ns | 390 ns | 1,560 ns |
Read the columns as three different designs. The 5-hop chain against a 1,000 ns budget passes with 610 ns spare — room for the real world to be a little worse than the datasheet. The same equipment stretched over 20 hops spends 1,560 ns, which is over the plus-or-minus 1,500 ns end-to-end limit that mobile TDD networks work to (ITU-T G.8271). Nothing broke. The chain simply got long enough for honest per-hop errors to add up past the line — which is exactly what a budget exists to tell you before the radios do.
Worst case or statistical? Two sums, two questions
The table above adds worst cases in a straight line: every hop at its maximum, every error in the same direction. That is the worst-case sum, and it is the only sum that guarantees the design. If 390 ns fits your budget, the chain fits even on its worst day.
Engineers also use a root-sum-square (RSS) sum: square each hop, add the squares, take the square root. For the same 5 hops that gives the square root of 5, times 78 ns — about 174 ns. The RSS figure answers a different question: what total should we typically expect, if each hop's error is independent and random in sign, so errors partly cancel? Both sums are honest. The mistake is using the smaller one as a guarantee: asymmetry error in particular is not random in sign, so on a real chain the truth usually sits between the two — and a design that only passes on the RSS sum has no margin when the biases line up.
Which limit are you actually budgeting against?
Mobile networks: plus-or-minus 1,500 ns. TDD radios must agree on when each transmission slot starts, and the end-to-end time alignment limit at the radio is plus-or-minus 1.5 microseconds from a common reference (ITU-T G.8271). The whole chain — grandmaster, every boundary clock, every link — shares that one allowance, which is why telecom profiles and clock classes exist.
Trading: 100,000 ns, but with receipts. MiFID II (RTS 25) requires high-frequency trading systems to timestamp with an accuracy of 100 microseconds — 100,000 ns — from UTC, and a granularity of 1 microsecond or finer. The same 390 ns chain passes that accuracy figure easily; the harder part in finance is usually proving and documenting the chain, hop by hop — which is, again, the budget.
Your own house limit. Many designs set an internal target tighter than any regulation — 1,000 ns end to end is a common planning figure — precisely so that measurement surprises, a swapped fibre, or one ageing clock cannot push the live network over the external limit. Budget against the internal target; report against the external one.
Blown budget: three fixes, priced in nanoseconds
Back to the 20-hop chain at 1,560 ns against a 1,500 ns limit — over by 60 ns. There are three honest ways back under, and the budget tells you what each buys:
| Fix | New per-hop total | New 20-hop total | Verdict |
|---|---|---|---|
| Better clocks: 50 ns → 30 ns (Class C limit) | 30 + 8 + 20 = 58 ns | 1,160 ns | Passes with 340 ns spare |
| Calibrate asymmetry: 20 ns → 5 ns | 50 + 8 + 5 = 63 ns | 1,260 ns | Passes with 240 ns spare |
| Remove one hop: 19 hops, same equipment | 78 ns (unchanged) | 1,482 ns | Passes with only 18 ns spare |
The order matters. Cutting the biggest per-hop term — the clock error — buys the most margin, because it is multiplied by every hop. Removing a hop buys the least and leaves the design one future change away from failing again. And note what is not on the list: turning a configuration knob and hoping. If the arithmetic does not close on paper, it will not close in production.
Try it yourself
Open the free PTP timing budget calculator and enter the worked example — 5 boundary clocks, 50 ns of time error each, 8 ns timestamp granularity, 20 ns of asymmetry per hop — and check the worst case: 390 ns, the total built in this guide. Then change only the hop count to 20 and watch the same honest equipment fail a 1,500 ns budget at 1,560 ns, and try the Class C fix (30 ns clocks) to bring it back to 1,160 ns. When you want to see those errors move over time instead of on paper, the PTP/SyncE timing simulator runs the whole chain live, and the PTP holdover planner answers the follow-up question: what happens to this budget when the grandmaster signal disappears?
- A timing budget is addition, not magic: in the worked example each hop adds 50 ns of clock error, 8 ns of timestamp granularity and 20 ns of asymmetry error — 78 ns a hop — so 5 hops give a 390 ns worst case, comfortably inside a 1,000 ns (1 microsecond) budget.
- Worst-case adding (every hop at its maximum, all in the same direction) is the only figure that guarantees anything. Root-sum-square adding gives about 174 ns for the same chain, but only as a statistical estimate for errors that are independent and random in sign — it is not a promise.
- The budget you must meet depends on the job: mobile TDD radios work to plus-or-minus 1.5 microseconds end to end (ITU-T G.8271), while MiFID II asks high-frequency trading systems for 100-microsecond accuracy to UTC — the same 390 ns chain is tight engineering in one world and trivial in the other.
- When a budget is blown, fix the biggest per-hop term first: in the 20-hop example, swapping 50 ns clocks for 30 ns clocks (the G.8273.2 Class C limit) cuts the total from 1,560 ns to 1,160 ns, while removing one hop only just scrapes under the limit at 1,482 ns.